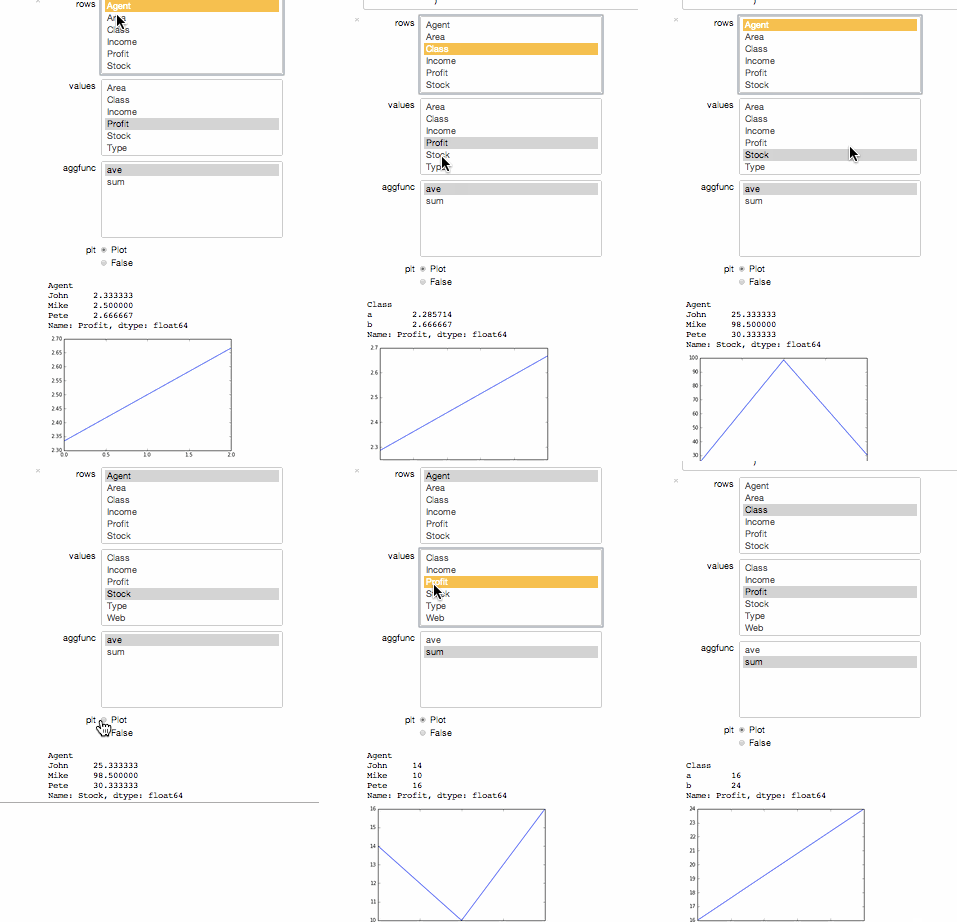
This post will focus on using the new widget and interact functionality of IPython 2 to generate Excel like interactive pivot tables. (Well almost you will get the idea)
One idea is to write a plugin that you can call on a file or dataframe with a magic command, and then an interactive Excel Like Pivot Table is produced.

Lets Create a Dataframe
The code below creates a pandas dataframe that we can use to pivot out some data. You will have to download the notebook and run it to see the final result as NBConvert cannot render it and it has to run against an open kernel. You can download the notebook at here
from pandas import Series, DataFrame, pivot_table
import numpy as np
import numpy

d = { 'Class'   : Series( ['a',  'b', 'b','a','a',  'b', 'b','a','a',  'b', 'b','a','a','b','b','b']),
      'Area'   : Series( ['North','East', 'South', 'West','North','East', 'South', 'West','North','East', 'South', 'West','South', 'West','South', 'West']),
      'Type' : Series( ['square', 'round','square', 'round', 'round', 'square', 'round', 'square', 'round', 'square','round', 'square',]),
      'Web'  : Series( ['Y','N','N','Y','Y','N','N','Y','Y','N','N','Y','Y','N','N','Y']),
      'Agent'   : Series( ['Mike',  'John', 'Pete','Mike',  'John', 'Pete','Mike',  'John', 'Pete','Mike',  'John', 'Pete','John', 'Pete','John', 'Pete']),
      'Income'   : Series( [20., 40., 90., 20.]),
      'Profit' : Series( [1., 2., 3., 4.,1., 2., 3., 4.,1., 2., 3., 4.,1., 2., 3., 4.]),
      'Stock' : Series( [20., 23., 33., 43.,12., 21., 310., 41.,11., 21., 31., 41.,11., 22., 34., 54.] )
     }
df = DataFrame(d)
print df
Now lets just create a nice pivot to see if everything is working. We call the sum function on the values for 'Profit' and 'Stock' for the 'Area' and 'Class' rows.
pivot_table( df, rows=['Area','Class'], values = ['Profit','Stock'], aggfunc=numpy.sum)
To make widgets to interact with we need to first create a function that would return 'visualy' to the workbook what we want. I included a plot for fun. We should be able to pass a matplotlib function like bar to it using the widget aswell. I struggled to pass the dataframe 'df' to the function so hardcoded it for now.
%pylab inline
def my_pivot( rows, values, aggfunc, plt=False):
    dfp = df
    piv = pivot_table( dfp, rows=rows, values=values, aggfunc=aggfunc)
    print piv
    if plt: plot( piv )
Lets just test this function to see if it works.
my_pivot(rows=['Area','Class'], values = ['Profit','Stock'], aggfunc=numpy.sum, plt=True)
Lets import some goodies to enable us to use the interactive widget. When you run this code for the first time you will see the selectors and then some error. This is because I did not set the default selector values. Select a column with only text values and then for 'values' a column like 'Income', 'Profit' or 'Stock'. You can also select if you want to sum or average them out. There is also a radio button to show or hide the plot.
from IPython.html.widgets import interact, SelectWidget, CheckboxWidget, RadioButtonsWidget
from IPython.display import display
i = interact( my_pivot,
                 rows    = SelectWidget(values=list(df.columns)),
                 values  = SelectWidget(values=list(df.columns)),
                 aggfunc = SelectWidget( values={ 'sum' : numpy.sum, 'ave' : numpy.average }),
                 plt     = RadioButtonsWidget( values = { 'Plot': True, 'False' : False } )
             )